A Tool for Mapping Wildland Urban Interface
5/4/25
Final Project for GEOG 4303 - Spatial Programming
Project leader: Max Warnock
Team members: Quin Browder, Victoria Madden
Link to the full research paper and code repository
Introduction
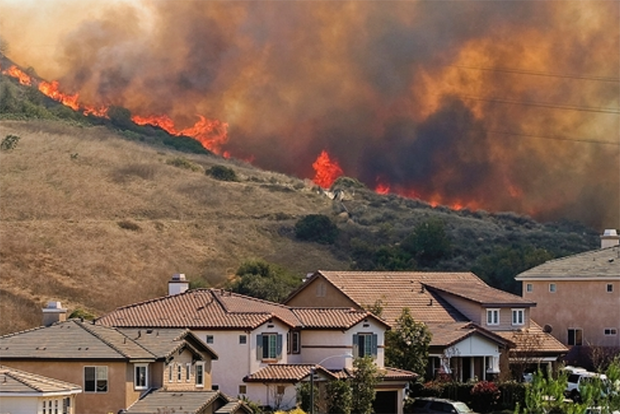
Between the bustling centers of urban development and the untamed wilderness lies a
boundary called the Wildland-Urban Interface (WUI). As suburban sprawl increases, so does the
WUI and its risks. This interface poses an opportunity for fire to spread from one type of land to
another – wildfires can enter the city and structure fires can spread to the forest [3]. Mapping this
boundary and its properties allows for identification of areas which present the largest risk of a
wide-spread fire and can help determine the best fire mitigation strategies for these areas.
Wildland Urban Interface (WUI) Definition
The WUI is an area where structures are built in or near wildland vegetation [2]. The U.S.
Federal Register defines the WUI as an area with at least 6.17 structures per square kilometer
and one of two vegetation requirements: either 50% or more of the land is covered in vegetation,
or the structures are within 2.4 kilometers of at least 5 square kilometers of 75% vegetation
coverage [10]. The first of these categories is considered the Wildland-Urban Intermix, and the
second is Wildland-Urban Interface [2]. However, different research questions may be interested
in slightly different mapping requirements, so these standard values are not hard coded into our
tool. Instead, the user inputs all the requirements for the intermix and interface including
thresholds for building density, vegetation cover, buffer distance to large areas of vegetation,
large vegetation area definitions, and moving window radii. The user can also request that the
interface and intermix be mapped using classifications representing proximity to the most
prominent vegetation types in the area.
Mapping and Data Sources
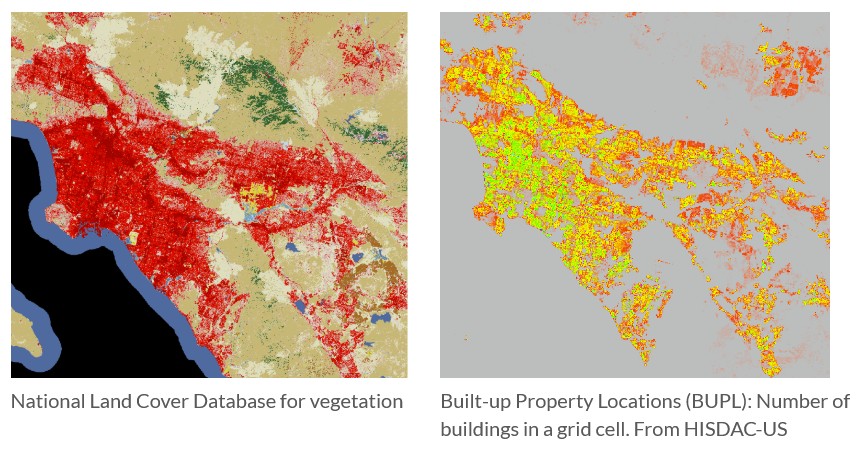
Our tool uses vegetation data from the National Land Cover Database (NLCD) [11], and
structure data from the Built-Up Property Locations (BUPL) layer from the Historical Settlement
Data Compilation for the U.S. (HISDAC-US) [1]. The tool package comes with clipped sample
data for Los Angeles, CA 2020, and the user also has the option to input data for other areas of
interest anywhere in the U.S. Both data sets are available back to 1985. The tool is designed so
that the user can simply clip an NLCD raster to their study area of interest, and the tool will clip
the BUPL layer (e.g. if using an unclipped BUPL layer (~30MB) for the entire U.S.). The NLCD
raster is provided at 30-meter resolution and has many classes representing different vegetation
types, as well as development data which we ignore [11]. The BUPL raster is provided at 250-
meter resolution and shows the number of structures within each cell [1].
Methods
Our tool begins with data preparation and utilizes ArcPy tools for this task. Since we are
using data sources with two different resolutions, we begin by resampling the smaller resolution
of the NLCD data to match the larger resolution of the BUPL data. This means that there is some
loss of data resolution for vegetation, but it allows us to use the HISDAC-US data source. We
also reproject the NLCD to match the BUPL projection to ensure that the rasters are comparable.
Finally, we use the ExtractByMask tool to clip the BUPL data to the input NLCD extent. We
found that ExtractByMask works better than ClipRaster for this purpose because the clip tool
produces “NoData” values on the edges of the raster which causes problems with future steps.
We also used the ArcPy SnapRaster feature to ensure that both rasters have the same size and
number of rows and columns [4]. Finally, we convert both NLCD and BUPL rasters into NumPy
arrays which allows us to start performing selections and map algebra operations very quickly
and effectively.
After data preparation is complete, our WUI mapping method follows six general steps derived in part thanks to the method outlined by Bar-Massada, et al [2]. The variables used below are the accepted standard values used in WUI mapping [2, 6], and users can input different values if they want to adjust the mapping output:
-
Run a moving window on the BUPL data and select cells with at least 6.17 buildings within a 1 km radius.
-
Run a moving window on NLCD vegetation (classes 41, 42, 43, 51, 52, and 72) to select areas with greater than and less than 50% vegetation.
-
From the raw resampled/post-processed NLCD data, select vegetation groupings of 5 square kilometers in areas of at least 75% vegetation cover using Region Group tool.
-
Buffer the 5 square kilometer vegetation areas to a given radius of 2.4 km.
-
Calculate WUI intermix by adding outputs from step 1 and 2.
-
Calculate WUI interface by adding the building density output from step 1, the vegetation selection of areas less than 50% from step 2, and the large vegetation area buffer from step 4.
Results
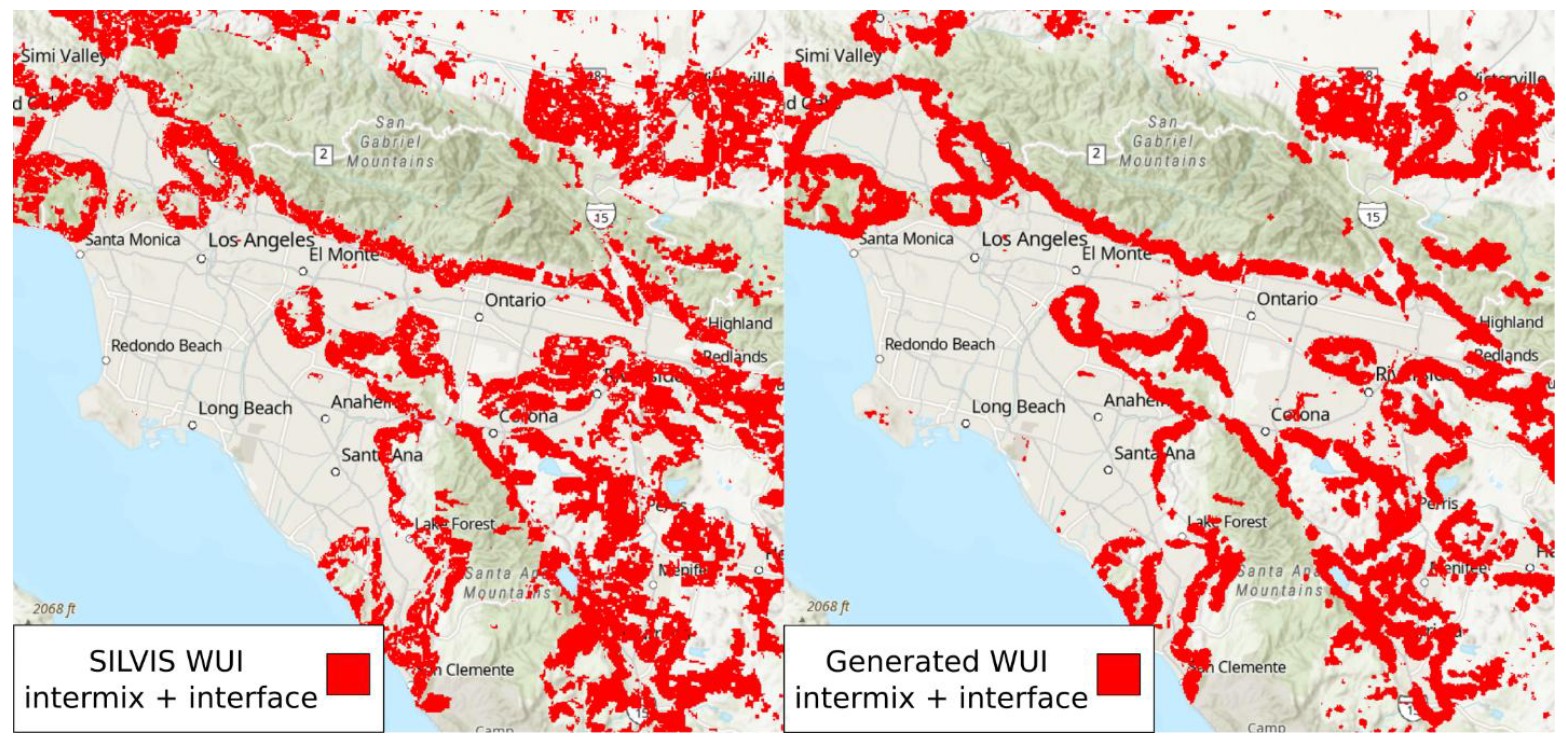 Left: SILVIS Lab WUI map for 2020. Right: WUI map for 2020 generated with our
tool.
Left: SILVIS Lab WUI map for 2020. Right: WUI map for 2020 generated with our
tool.
Assessing WUI Mapping Results
Considerations need to be made when comparing WUI maps. For example, the SILVIS
Lab WUI maps use NLCD data and U.S. Census data for buildings/developments [6]. This
building data source is different than the HISDAC-US data source we use, meaning this
difference in data is an area where inconsistencies between the maps can arise. This may be a
reason why we found that a lower building threshold produces more agreement between our
maps. The U.S. census data appears to be classifying these low-density areas differently than the
HISDAC-US data, which is likely why we had to reduce the threshold to increase agreement.
Another consideration when making these comparisons is that WUI maps from the SILVIS Lab are only available once a decade due to the low temporal resolution of the U.S. census data [6]. This means it’s important to compare generated maps and SILVIS maps for years as close to each other as possible. While our method allows users to generate WUI maps every 5 years (HISDAC-US temporal resolution) [1], this could lead to inaccurate comparison results if a mid-decade WUI map was compared to a SILVIS map.
WUI Mapping With Vegetation
Our tool also incorporates the option to map the WUI with vegetation classes. This is
useful for quickly observing what types of fuels are near certain WUI areas which can help
assess fire risk [12]. The tool maps vegetation into two classes of ‘forest’ (NLCD classes 41, 42,
43) or ‘shrubland’ (NLCD classes 52, 71) or both. If the user answers ‘yes’ to vegetation
mapping, the script will run an additional two arrays through the moving window for the forest
and shrubland selections. In this case, the kernel radius of the moving window applied to these
arrays is a fixed value of 1 because this will prevent larger user input radii from unnecessarily
expanding vegetation class selections (e.g. if a user wants to map general WUI with a larger
radius). From the output arrays, we select forest and shrubland areas with coverage greater than
20%. Next, we buffer these areas to 2.4 km using the same polygon buffering method outlined
earlier. The goal of using a moving window and buffering the vegetation classes is to produce a
vegetation map that overlaps with the final WUI map we create. Generally, the WUI map will
not overlap completely with vegetation because many areas of the WUI are developed and are
classified as developed in the NLCD raster. Applying a moving window ensures that we are
selecting vegetation areas with a meaningful amount of each specific vegetation type. Buffering
ensures that no WUI areas are left blank without a vegetation class. This vegetation mapping
process is applied after the normal WUI map has been created. This allows us to simply apply
our buffered vegetation map to the WUI map by adding the NumPy arrays. The result retains the
normal WUI map footprint and intermix vs. interface classes, but now includes extra classes to
identify the most prominent types of vegetation in proximity to the WUI.
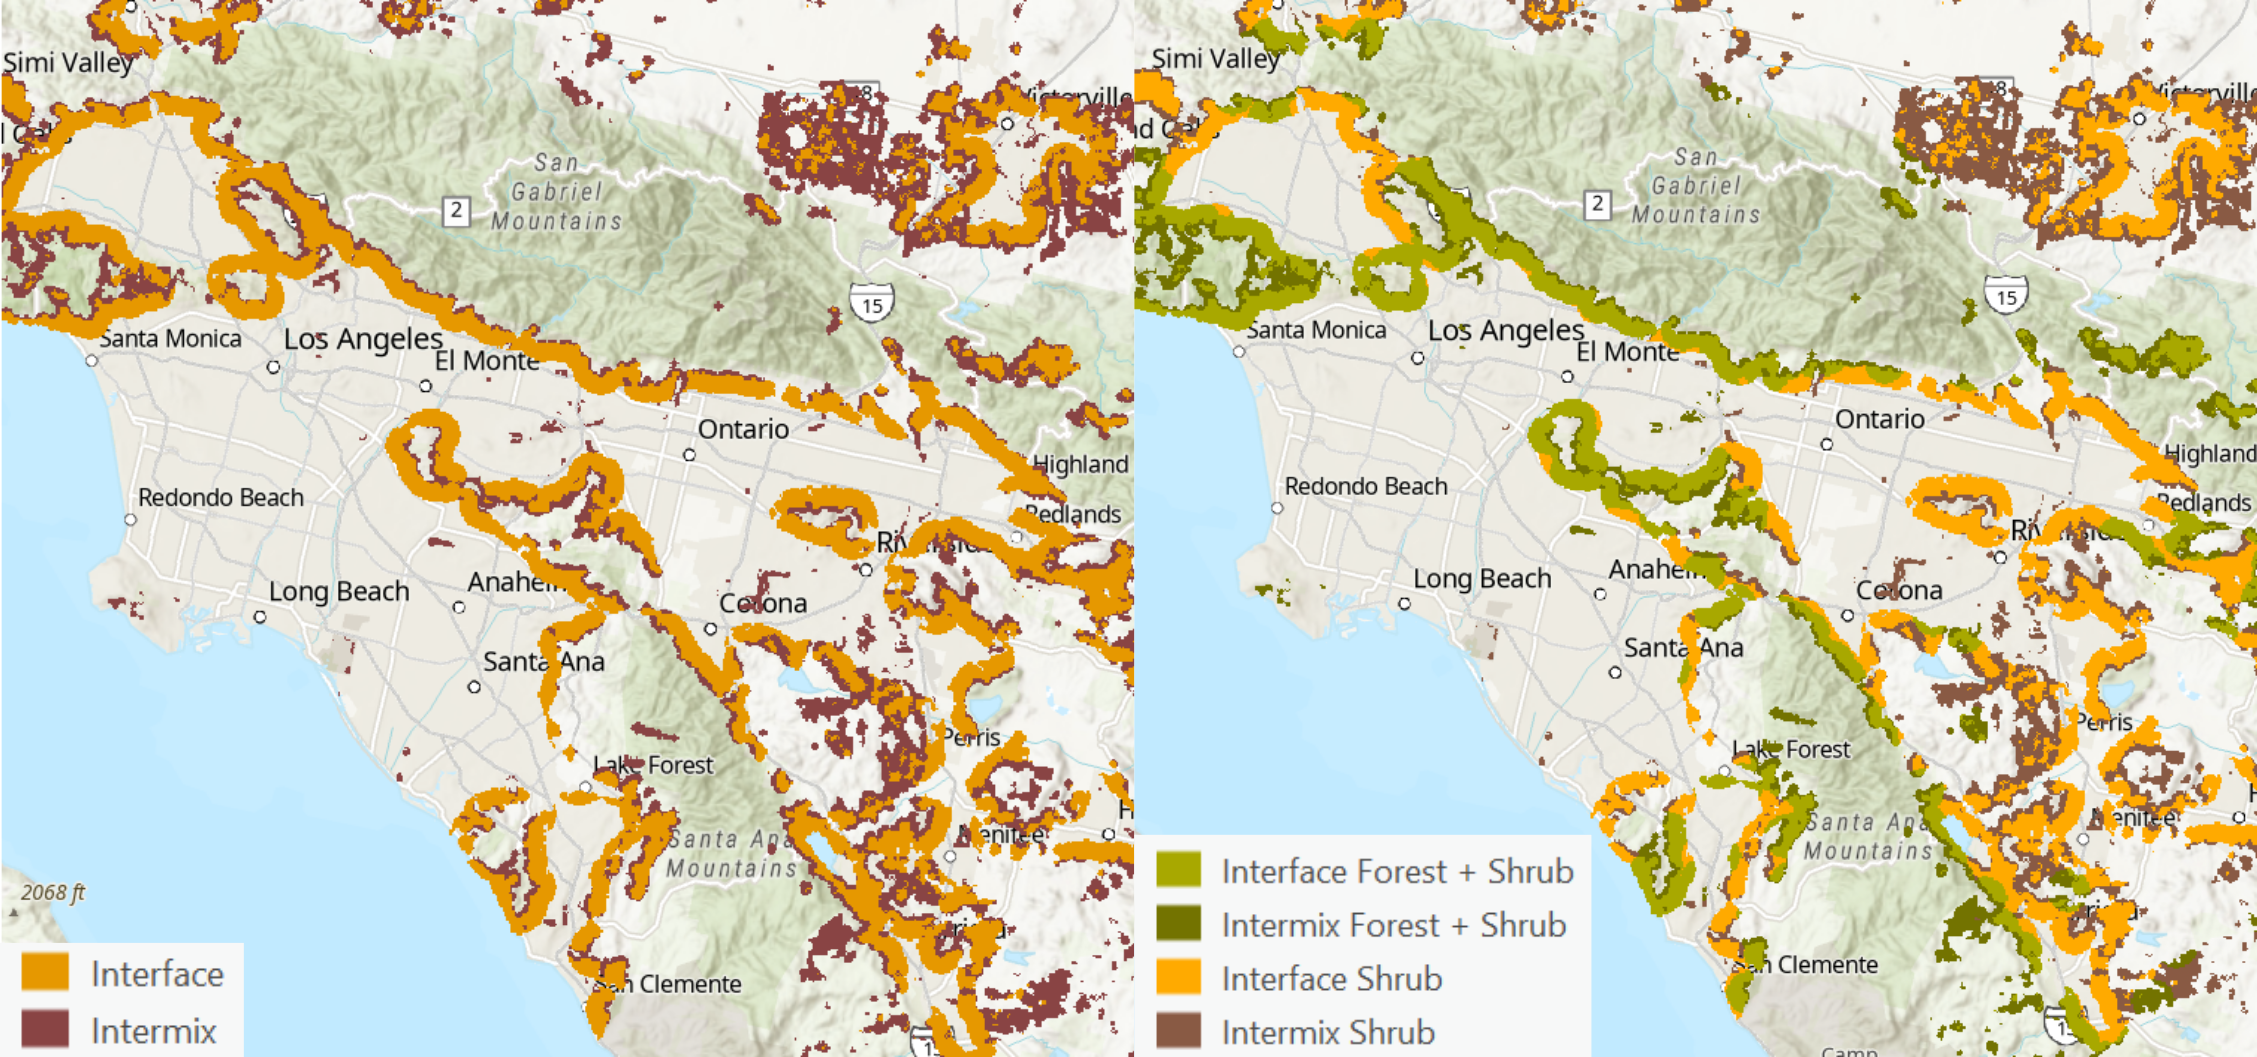 Left: a basic WUI map generated for Los Angeles, 2020. Right: WUI map with added
classes differentiating vegetation types in proximity to the WUI. In this case, there are only 4
classes, but other locations could have up to 6 classes which would include areas of primarily
forest classes.
Left: a basic WUI map generated for Los Angeles, 2020. Right: WUI map with added
classes differentiating vegetation types in proximity to the WUI. In this case, there are only 4
classes, but other locations could have up to 6 classes which would include areas of primarily
forest classes.
Future Work
Future work for this project could include generating historical WUI maps for
comparison with maps of suburban/urban burn areas to analyze the accuracy of the model at
predicting which areas are at risk. The tool could also be run on data for all available years, and
for the entire U.S. to produce a database similar to the SILVIS Lab WUI map database. The
SILVIS Lab has also used their WUI maps to produce WUI change maps which represent how
much the WUI has increased over time [6]. Our method opens the possibility for creating WUI
change maps as well, and on a finer temporal scale. Another area of future work could involve
WUI mapping with building density classes [6]. Our method for mapping WUI with vegetation
classes could easily be applied to building density as well, and this type of map may be useful for
understand how populations are affected by the WUI [6].
Conclusion
The Wildland-Urban Interface is an important and ever-changing consideration for an
expanding society. It presents unique risks and challenges that are best prepared for if city
planners have an accurate map of the WUI. The goal of our tool is to understand where the WUI
is, what vegetation fuels are nearby, and provide a method to determine how it has changed over
time. The tool also aims to give the user an idea of how well the mapping process works by
running agreement statistics with another trusted WUI map. The tool also gives the user the
freedom to quickly test different variables within the WUI mapping process to be more specific
for different criteria. This tool, and others like it, can be used to help manage our society’s
suburban sprawl more safely.
Works Cited
[1] Ahn, Y., Leyk, S., Uhl, J.H. et al. An Integrated Multi-Source Dataset for Measuring
Settlement Evolution in the United States from 1810 to 2020. Sci Data 11, 275 (2024).
https://doi.org/10.1038/s41597-024-03081-x
[2] Bar-Massada, Avi; Stewart, Susan I.; Hammer, Roger B. et al. 2013. Using structure
locations as a basis for mapping the wildland urban interface. Journal of Environmental
Management. 128: 540-547.
https://www.fs.usda.gov/rm/pubs_other/rmrs_2013_bar_masada_a001.pdf
[3] Colorado State Forest Service. Wildland Urban Interface. Colorado State University.
https://csfs.colostate.edu/wildfire-mitigation/colorados-wildland-urban-interface/
[4] Esri, ArcGIS Pro. Snap Raster (Environmental setting): https://pro.arcgis.com/en/pro-
app/latest/tool-reference/environment-settings/snap-raster.htm
[5] Google Machine Learning. Classification: Accuracy, recall, precision, and related metrics.
ML Concepts. https://developers.google.com/machine-learning/crash-
course/classification/accuracy-precision-recall#false_positive_rate
[6] Radeloff, Volker C.; Helmers, David P.; Kramer, H. Anu. et al. 2018. Rapid growth of the
US wildland-urban interface raises wildfire risk. Proceedings of the National Academy of
Sciences. 115(13): 3314-3319. https://doi.org/10.1073/pnas.1718850115
[7] Scikit Learn. Confusion Matrix. https://scikit-
learn.org/stable/modules/generated/sklearn.metrics.confusion_matrix.html
[8] Stack Overflow. How to Write a Confusion Matrix. 27 Jan, 2010.
https://stackoverflow.com/questions/2148543/how-to-write-a-confusion-matrix
[9] Uhl, J. H., Leyk, S., McShane, C. M., Braswell, A. E., Connor, D. S., and Balk, D.: Fine-
grained, spatiotemporal datasets measuring 200 years of land development in the United States,
Earth Syst. Sci. Data, 13, 119–153, https://doi.org/10.5194/essd-13-119-2021, 2021
[10] USDA and USDI, 2001. Urban wildland interface communities within vicinity of Federal
lands that are at high risk from wildfire. Federal Register 66, 751e777. Retrieved from:
http://www.gpo.gov/fdsys/pkg/FR-2001-08-17/pdf/01-20592.pdf.
[11] U.S. Geological Survey (USGS), 2024, Annual NLCD Collection 1 Science Products: U.S.
Geological Survey data release, https://doi.org/10.5066/P94UXNTS.
[12] SILVIS Lab. The Global Wildland-Urban Interface (WUI) 2020. University of Wisconsin-
Madison. https://geoserver.silvis.forest.wisc.edu/geodata/fast/globalwui/