Analysis of Vegetation Health in Rocky Mountain National Park Using NDVI Data from 2000 to 2024
11/22/25
Link to my complete analysis and Python code
Introduction
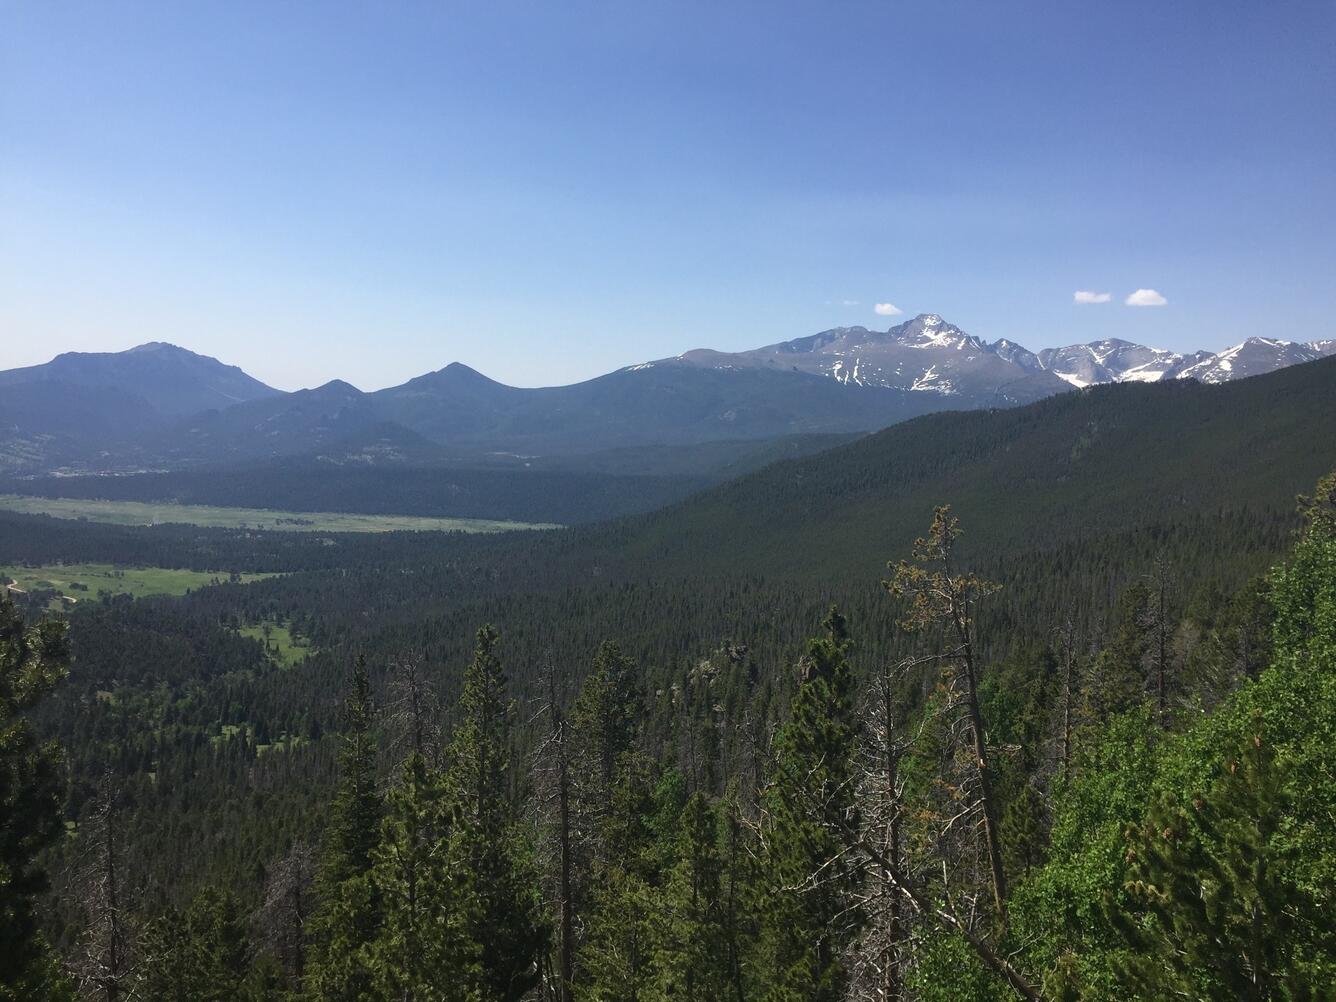
Rocky Mountain National Park (RMNP) in Colorado is known for its impressive mountains, forests, alpine landscapes, and wildlife. While there are many important ecological features in the park, pine forests are especially important for a variety of reasons. Pine trees in the park help to reduce erosion, regulate temperatures, and provide important habitat for many birds and animals (Colorado State Forest Service). However, in recent decades, these trees have been under threat from pine bark beetles and wildfires. To analyse the impact of these threats, I will be using the Normalized Difference Vegetation Index (NDVI) from the timeframe of 2000 to 2024. This index measures “greenness” of vegetation using remotely sensed data, which helps to quantify vegetation health.
 Pine Bark Beetles in Rocky Mountain National Park
According to the National Park Service, there are 17 native species of pine bark beetles common in the park, and for decades, periodic outbreaks were relatively common but of small scale. Pine bark beetle populations are affected by winter temperatures, with consistent periods of low temperatures needed to kill off beetles and prevent their populations for growing too rapidly. However, warmer average temperatures in the park in recent decades have allowed beetle populations to dramatically increase, with a peak in severity around 2009 when a large percentage of trees in the park were killed (Mountain Pine Beetle. NPS). The pine beetles kill lodgepole pine, ponderosa pine, limber pine, Engelmann spruce, subalpine fir, and Colorado blue spruce (Mountain Pine Beetle. NPS).
Wildfires in Rocky Mountain National Park
Fires are a natural part of forest ecosystems. However, with impacts from climate change and pine bark beetles, fires in the park and surrounding area have been increasing in severity and size in recent years (Fire History. NPS). In 2012, the Fern Lake Fire burned over 3,500 acres in the park, with beetle kill trees exacerbating conditions. In 2020, the Cameron Peak and East Troublesome Fires burned roughly 30,000 acres within the park (Fire History. NPS).
Timeframe
To analyze the impacts of pine beetles and wildfires, I will be using NDVI data from 2000 to 2024. This time frame will encompass the beginnings of the pine beetle outbreaks starting in the early 2000s through 2009, and it will also capture the more recent wildfires from 2012 and 2020, as well as any recent regrowth from these impacts. Additionally, I’m only interested in the vegetation health of pine trees, so I will be downloading data from January to account for this. In January, the only vegetation cover should be pine trees, with other vegetation either covered in snow or dormant.
Data
I will be using Moderate Resolution Imaging Spectroradiometer (MODIS) NDVI data downloaded from NASA’s EarthData catalog. Specifically, I will be downloading via NASA’s Application for Extracting and Exploring Analysis Ready Samples (AppEEARS) using the earthpy package. This will allow me to access the data quickly in Github Codespaces.
Results
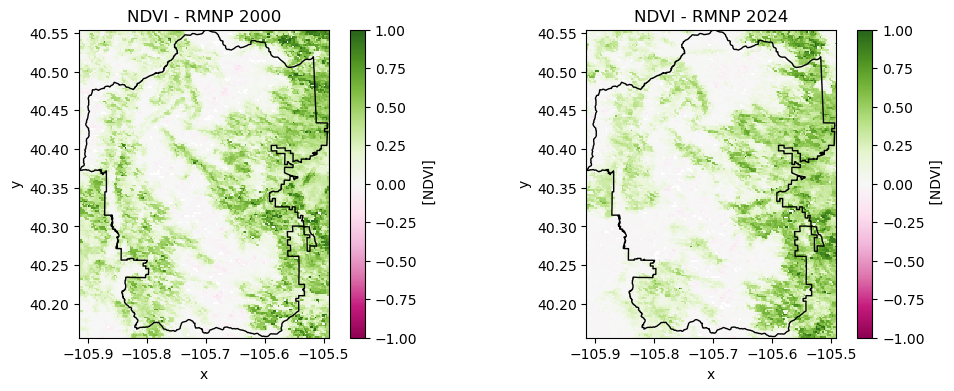
Figure 1: These side-by-side maps compare NDVI in 2000 vs. 2024. Darker greens represent healthier vegetation, whereas whites/pinks represent less healthy vegetation.
Figure 2: This map shows change in NDVI values for the two date slices. I subtracted the earlier date slice (2000-2012) from the more recent date slice (2012-2024). The result shows large areas of pink which indicates a decrease in vegetation health over the time period. There are also some green areas which indicate an increase in vegetation health over the time period. Overall, it’s not surprising to see a decrease in NDVI values due to the impacts from pine beetles and wildfires, as described above.
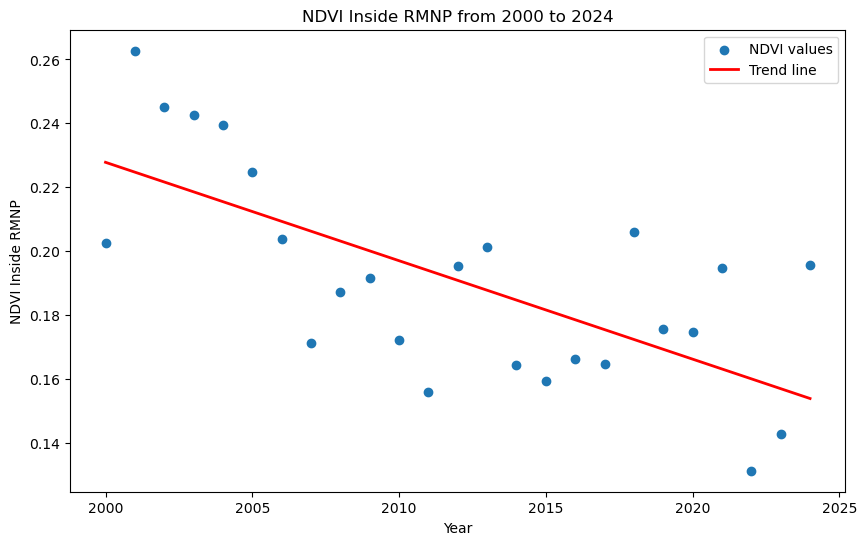
Figure 3: Plot showing mean NDVI values from 2000 to 2024 inside RMNP with a linear regression trendline. The slope of the trendline is -0.00308, and has a clear negative trend on the plot, meaning that NDVI values have decreased in the park over the study period.