Pawnee National Grasslands Land Swap Project
Final Project for GEOG 4563-5563: Earth Analytics Applications
Our Team:
- Kayleigh Ward, PhD; Environmental Sociologist
- Nate Hofford, MS; Botanist
- Max Warnock, BA; Geographer
Project Background:
This project centers around using geospatial and species data to optimize potential land swaps on the Pawnee National Grassland to consolidate ownership and de-fragment habitat. Our goal is to create a public tool to identify these land swaps, and provide evidence for recommendations for state agencies.
Goals:
- Create a tool that analyzes ownership patterns and measure fragmentation of federally owned land.
- Identify high-impact parcels whose transfer would objectively maximize consolidation of federally owned land.
- Synthesize recommendations for agencies to achieve various goals
This portfolio focuses on goal #2 as goals #1 and #3 will occur over the summer of 2026.
Repository:
You can find the notebooks for each portion of this project at our public repository here.
Introduction
The Pawnee National Grassland (PNG) in northeastern Colorado encompasses 193,060 acres of federally managed land, but this area is highly fragmented. Instead of contiguous area, the land is a mosaic of state, federal, and private ownership. National Grasslands were created from multiple 19th-century relief efforts put in place by the Federal government to help restore land and industry lost during colonial expansion, the Dust Bowl, and the Great Depression (U.S. Forest Service, n.d.).
The current federal land base at PNG was largely assembled following the Dust Bowl, when the federal government purchased depleted agricultural lands from distressed farmers and began restoring short-grass prairie. Between 1934 and 1954, the government used both direct purchase and “mutual transfer” (land swaps) to consolidate parcels into more economically manageable tracts for both private owners and the government (Rhoads & Rhoads, n.d.). The Soil Conservation Service managed these tracts until 1954, when administration was transferred to the U.S. Forest Service, and the Pawnee National Grassland was formally designated in 1960 (U.S. Forest Service, n.d.).
However, a mosaic of land ownership still exists and creates challenges for land managers. Fragmentation complicates coordinated grazing and habitat management and limits contiguous areas available for wildlife movement. Fragmented landscapes exhibit altered ecological processes, as the spatial arrangement of land cover directly affects biodiversity, nutrient cycling, and ecosystem services (Riitters, 2013). At the PNG specifically, oil and gas wells and associated road networks have further fragmented the landscape, leaving few large intact core areas even within the federal land boundary (Baynard, 2017).
Land consolidation through targeted exchanges is a well-established approach to reducing fragmentation in federal land systems. Powers et al. (2022) demonstrated that strategically rearranging inaccessible public lands in Montana improved habitat conservation and landscape connectivity. Their work showed that conservation reserve designs accounting for connectivity could increase habitat value for multiple species while also providing economic benefits to landowners willing to exchange or sell parcels. This project applies a similar logic to the PNG, using spatial metrics to identify which privately/state held parcels would most efficiently increase the contiguity and compactness of federally managed land.
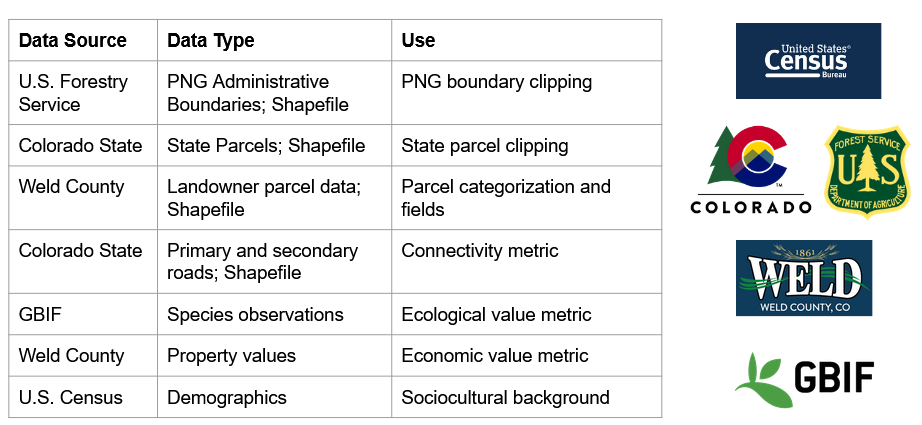
Data Overview:
Methods:
Each section of this project utilized an application of different methods. We recommend viewing the header of each notebook to see an expanded explanation of the methodology used in each part of this project.
However, in sum, our analysis begins with the construction of a unified study boundary by integrating USFS administrative data with parcel-level datasets from Weld County, ensuring all spatial layers are aligned to a common coordinate reference system.
Second, ecological data were incorporated by querying species occurrence records from the Global Biodiversity Information Facility (GBIF) for key grassland and animal species to (in the future) aggregate these observations to the parcel level to generate ecological value indicators.
Third, parcel data were queried dynamically via an ArcGIS FeatureServer and processed into GeoDataFrames, where ownership (federal, state, private) and economic attributes (e.g., total and assessed value per acre) were standardized.
Lastly, using geometric relationships and, where applicable, graph-based methods, parcels were grouped into ownership-based clusters to quantify fragmentation and consolidation potential by creating both continguous area and edge ratio scores.
The resulting metrics include parcel value (land value), ecological value, and continguous value which will be the basis of a multi-criteria framework for prioritizing land swaps that improve landscape connectivity while maintaining economic feasibility. Final outputs include spatial datasets, maps, and summary tables designed to support decision-making for strategic land exchange and grassland management. In this portfolio we feature the maps created in this project.
There is one outstanding value that still needs to be calculated–connectivity value–which incoporates whether a parcel is “touching” a road (which we will use a buffer to identify relevant parcels). Lastly, the parcel matrix and accompanying app will be completed over the summer of 2026.
Pawnee National Grasslands Property Boundary Data
This project relies on publicly available property boundary data. The Pawnee National Grasslands are located in Weld County, and we used Weld County’s GIS Hub to download parcel level vector data. This GeoDataFrame includes an attribute table with information about property ownership, address, and polygon geometry (and more) for each parcel. From this, we are able to select federal, state, and privately owned land and map these different property types.
Grassland Master Boundary
The Pawnee National Grasslands include a mix of federal, state, and privately owned land. After researching online, we were unable to find a shapefile for the master boundary (official extent) of the grasslands. A resource for the master boundary can be found here Pawnee National Grasslands FSBaseMap. However, this resource provides the file as a “Vector Tile Service” which is not editable. We needed an editable shapefile of the master boundary in order to clip all of our downstream data to the study area. Therefore, using the resource above, we traced exact boundary in ArcGIS Pro to create an editable shapefile.
Figure 1: This map shows the boundaries of the Pawnee National Grasslands. The master boundary shows the official extent of the Grasslands which includes a mix of federal, state, and privately owned property. The transparent areas are private property. The map shows the fragmented nature of land ownership on the grasslands. Notice the higher degree of contiguity of federally owned land on the western area of the grasslands.
Subsetting to the Western Half of the Grasslands
In order to narrow our initial study area and potentially identify higher impact land swaps, we are focusing our study on the western half of the Grasslands. This area already has a higher degree of contiguity of federally owned land, and provides the potential to improve this further.
Figure 2: This map shows parcel data for the western Pawnee National Grasslands. Private property boundaries are included in white.
The method for downloading and preparing the boundary data can be found in the ‘boundaries.ipynb’ in our repository.
Herbivores of Pawnee National Grasslands
The goal of this project is to also identify land swap locations that will provide the highest ecological benefit. Therefore, we will incorporate species data into our analysis. Two foundational species on the Pawnee National Grasslands are Prairie dogs (Cynomys ludovicianus) and Pronghorn (Antilocapra americana). According to Kotliar et al. (2006), the Prairie Dog fits the criteria of a keystone species, providing important interactions between multiple parts of the grassland ecosystem. Pronghorn, while not usually referred to as a keystone species, are another important and iconic part of the grassland ecosystem (Millspaugh et al., 2021). We use data from the Global Biodiversity Information Facility (GBIF) to map the locations of these species to understand their presence and distribution on the grasslands.
Figure 3: This map shows the distribution of Pronghorn and Prairie dog observations on the western Pawnee National Grasslands. GBIF data is collected by citizen scientists.
Considerations for GBIF Citizen Science Data
GBIF data is collected by citizen scientists through a variety of methods including popular tools like iNaturalist. Therefore, the distribution of species data can often influenced by factors such as accessibility and population. For example, species observations are more likely to be recorded in areas where more people go outside. Inaccessible areas are often less recorded. This phenomenon can be observed in the above figure. For example, in the south eastern portion of the map, species observations are clustered along roads. This representation may be heavily influenced by human accessibility patterns, and not reflect the actual distribution of the species.
Grasses of Pawnee National Grasslands
Continuing with identifying land swaps with the highest ecological benefit, we also mapped five different grasses potentially present on the Pawnee National Grassland. Based on consulting a USDA Forest Service technical reports (Hazlett, 1998), the observations of 5 grasses, including blue grama(Bouteloua gracilis), buffalograss(Bouteloua dactyloides), sideoats grama(Bouteloua curtipendula), western wheatgrass(Pascopyrum smithii), and needle-and-thread (Hesperostipa comata), are pulled from GBIF for each parcel within the Pawnee National Grassland boundary.
Figure 4: This map shows the distribution of four of the five grasses identified through research on the potential grass species present at the Pawnee National Grassland. Notably, we see the grasses clustered around the Shortgrass Steppe (SGS) Long Term Ecological Research (LTER) site to the northeast, but this does tell us these species do live on this grassland.
Future work
Due to issues with access and where people may be observing grasses, we will need to create a equal score to append to each parcel as each parcel has the potential of currently (or in the future) hosting these grasses. We will use the LTER site to create a ecological value for grasses to apply to each parcel.
Land Values of Pawnee National Grasslands
The goal of this project is to also identify land swaps of most economic benefit based on market and tax assessed values. To do this, parcel-level economic data from Weld County is used to quantify the value of land within the Pawnee National Grassland boundary. Parcel attributes such as total market value (TOTALACT) and assessed land value (LANDASD) are extracted and “normalized” (e.g., per acre) to generate an economic value metric for each parcel.
For the purposes of understanding the economic value of land simple math is used to calculate the market or tax assessed value per acre. These metrics allow for comparison across parcels of different sizes and allows us to constrain the extreme values that the Shortgrass Steppe (SGS) Long Term Ecological Research (LTER) at PNG incorporates into the data:
TOTALACT / GIS_Acres→ market value per acreLANDASD / GIS_Acres→ assessed value per acre
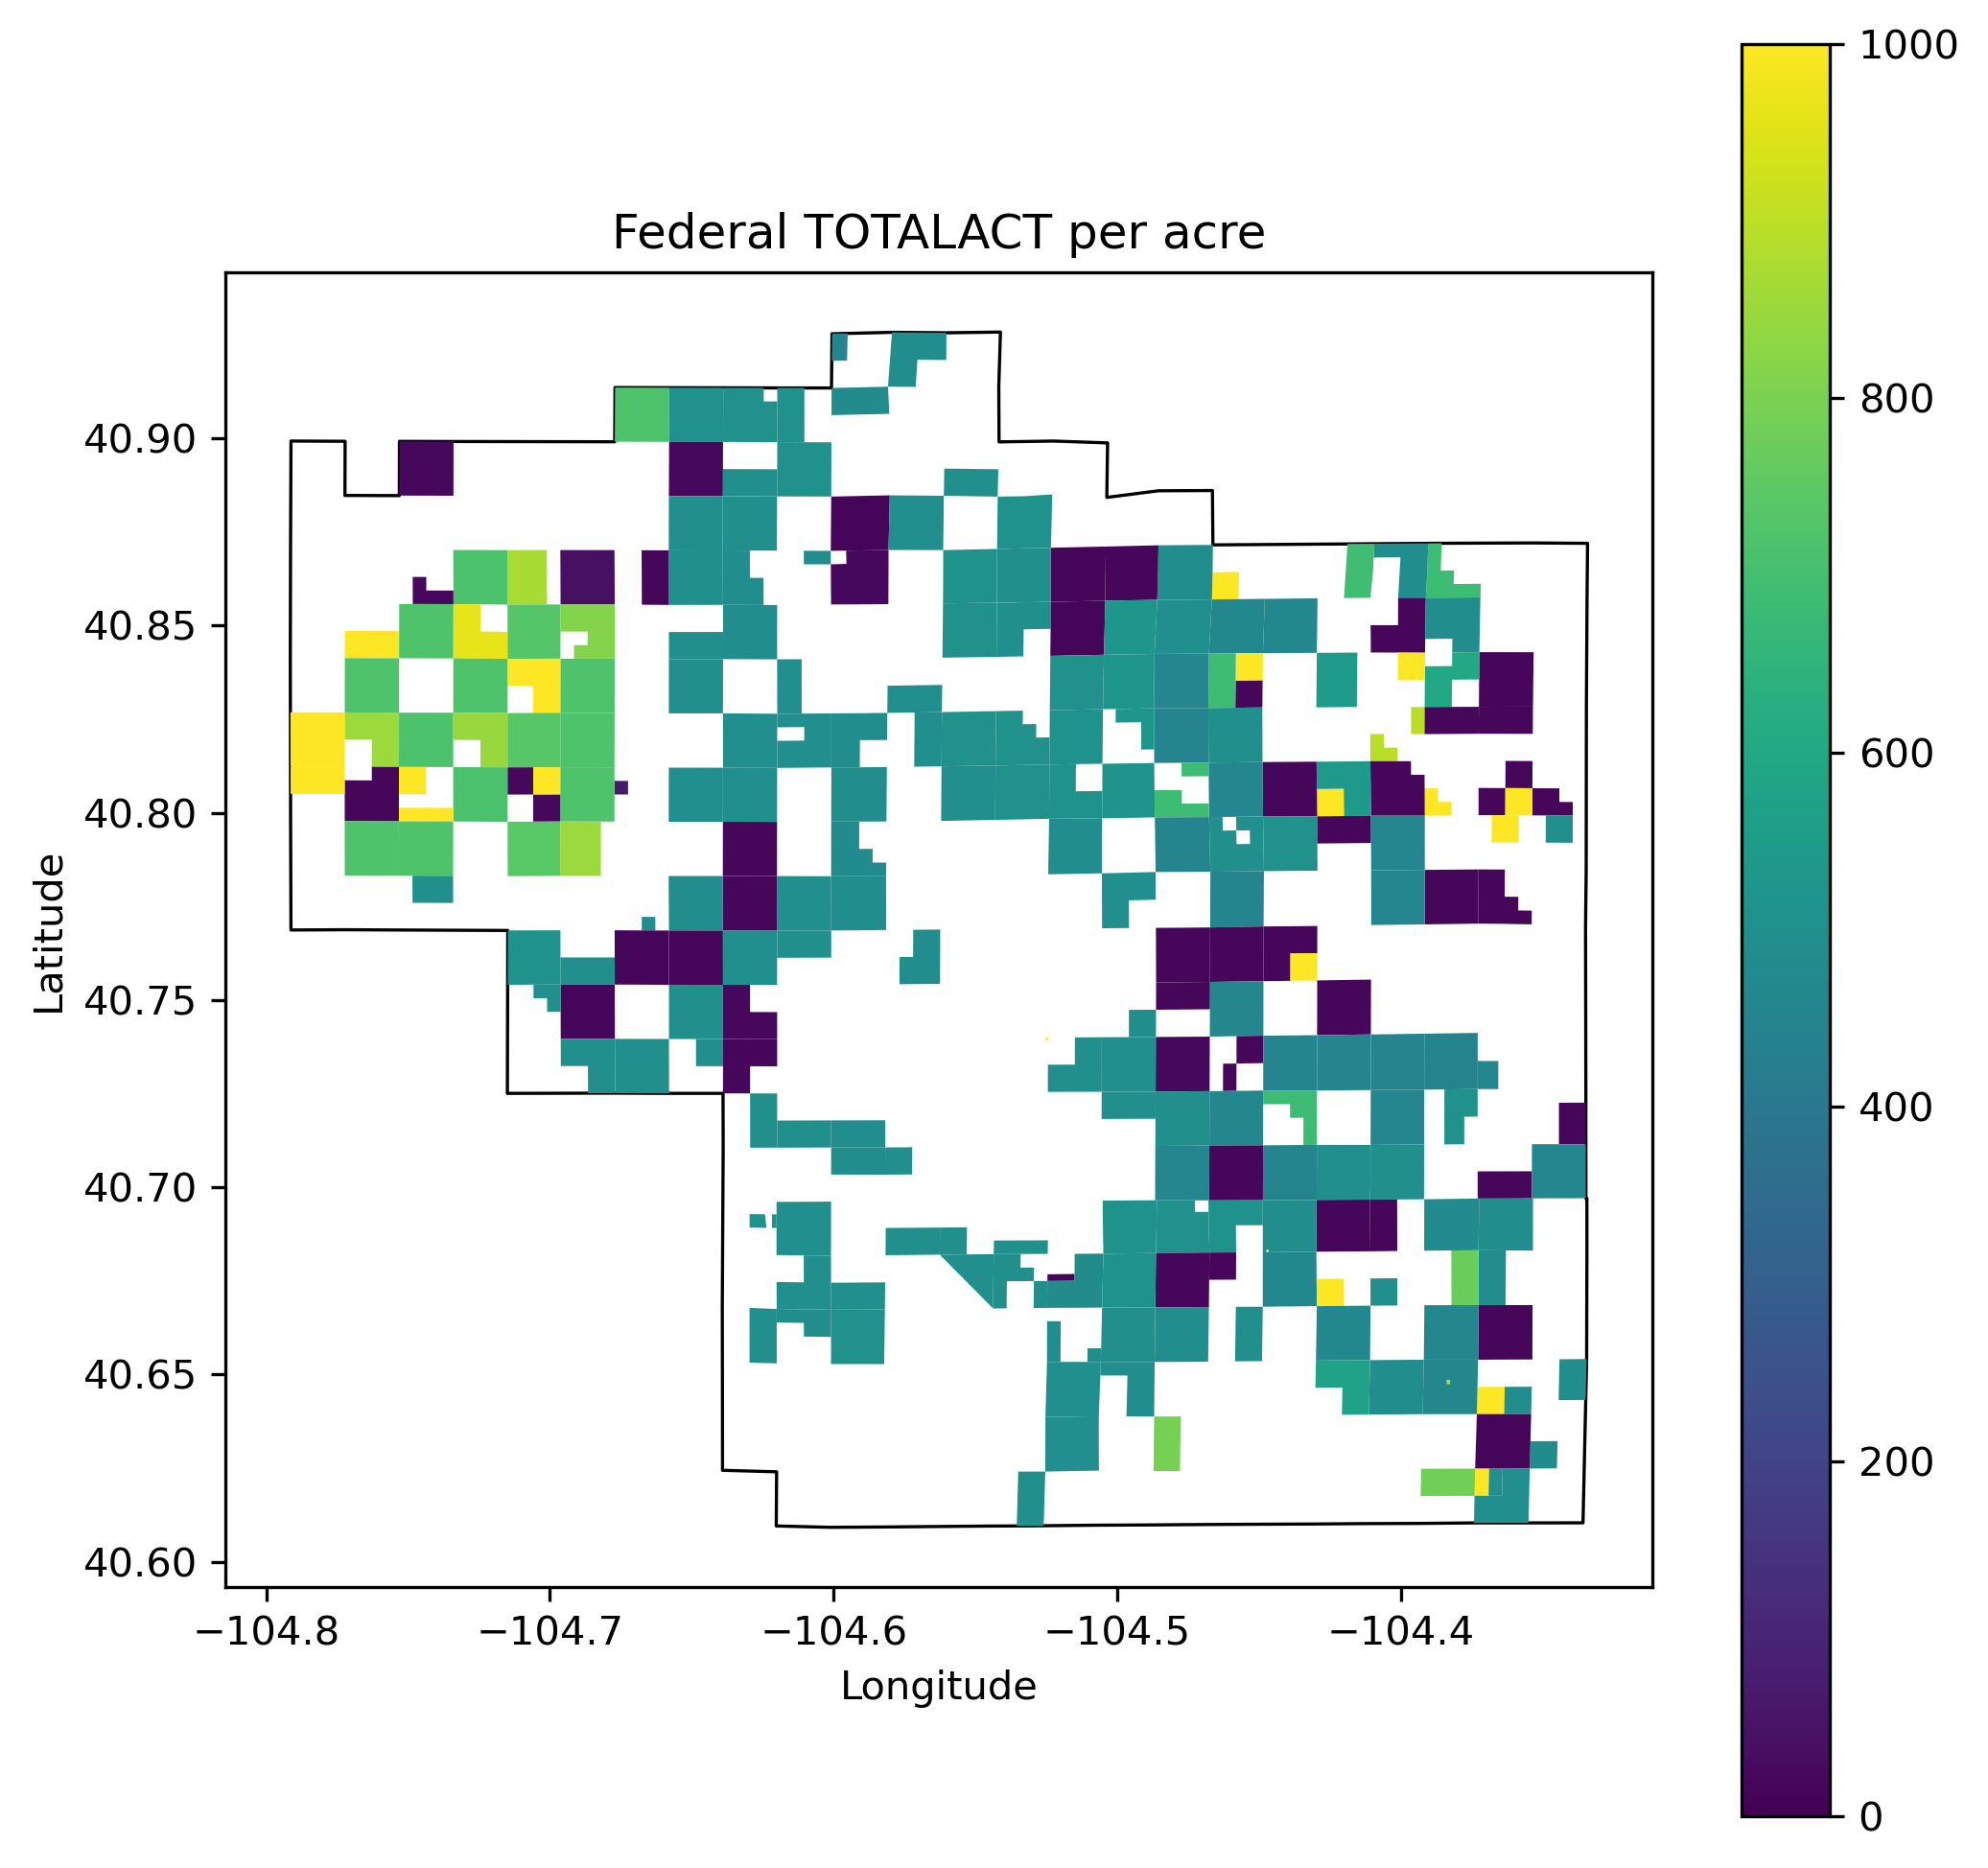
Figure 5: This map shows the total market value per acre for federal parcels on Western Pawnee (the legend is in US Dollars). Due to TOTALACT counting infrastructure, such as builings, oil wells, etc we can easily identify which federal parcels likely contain more expensive infrastructure compared to state parcels below.
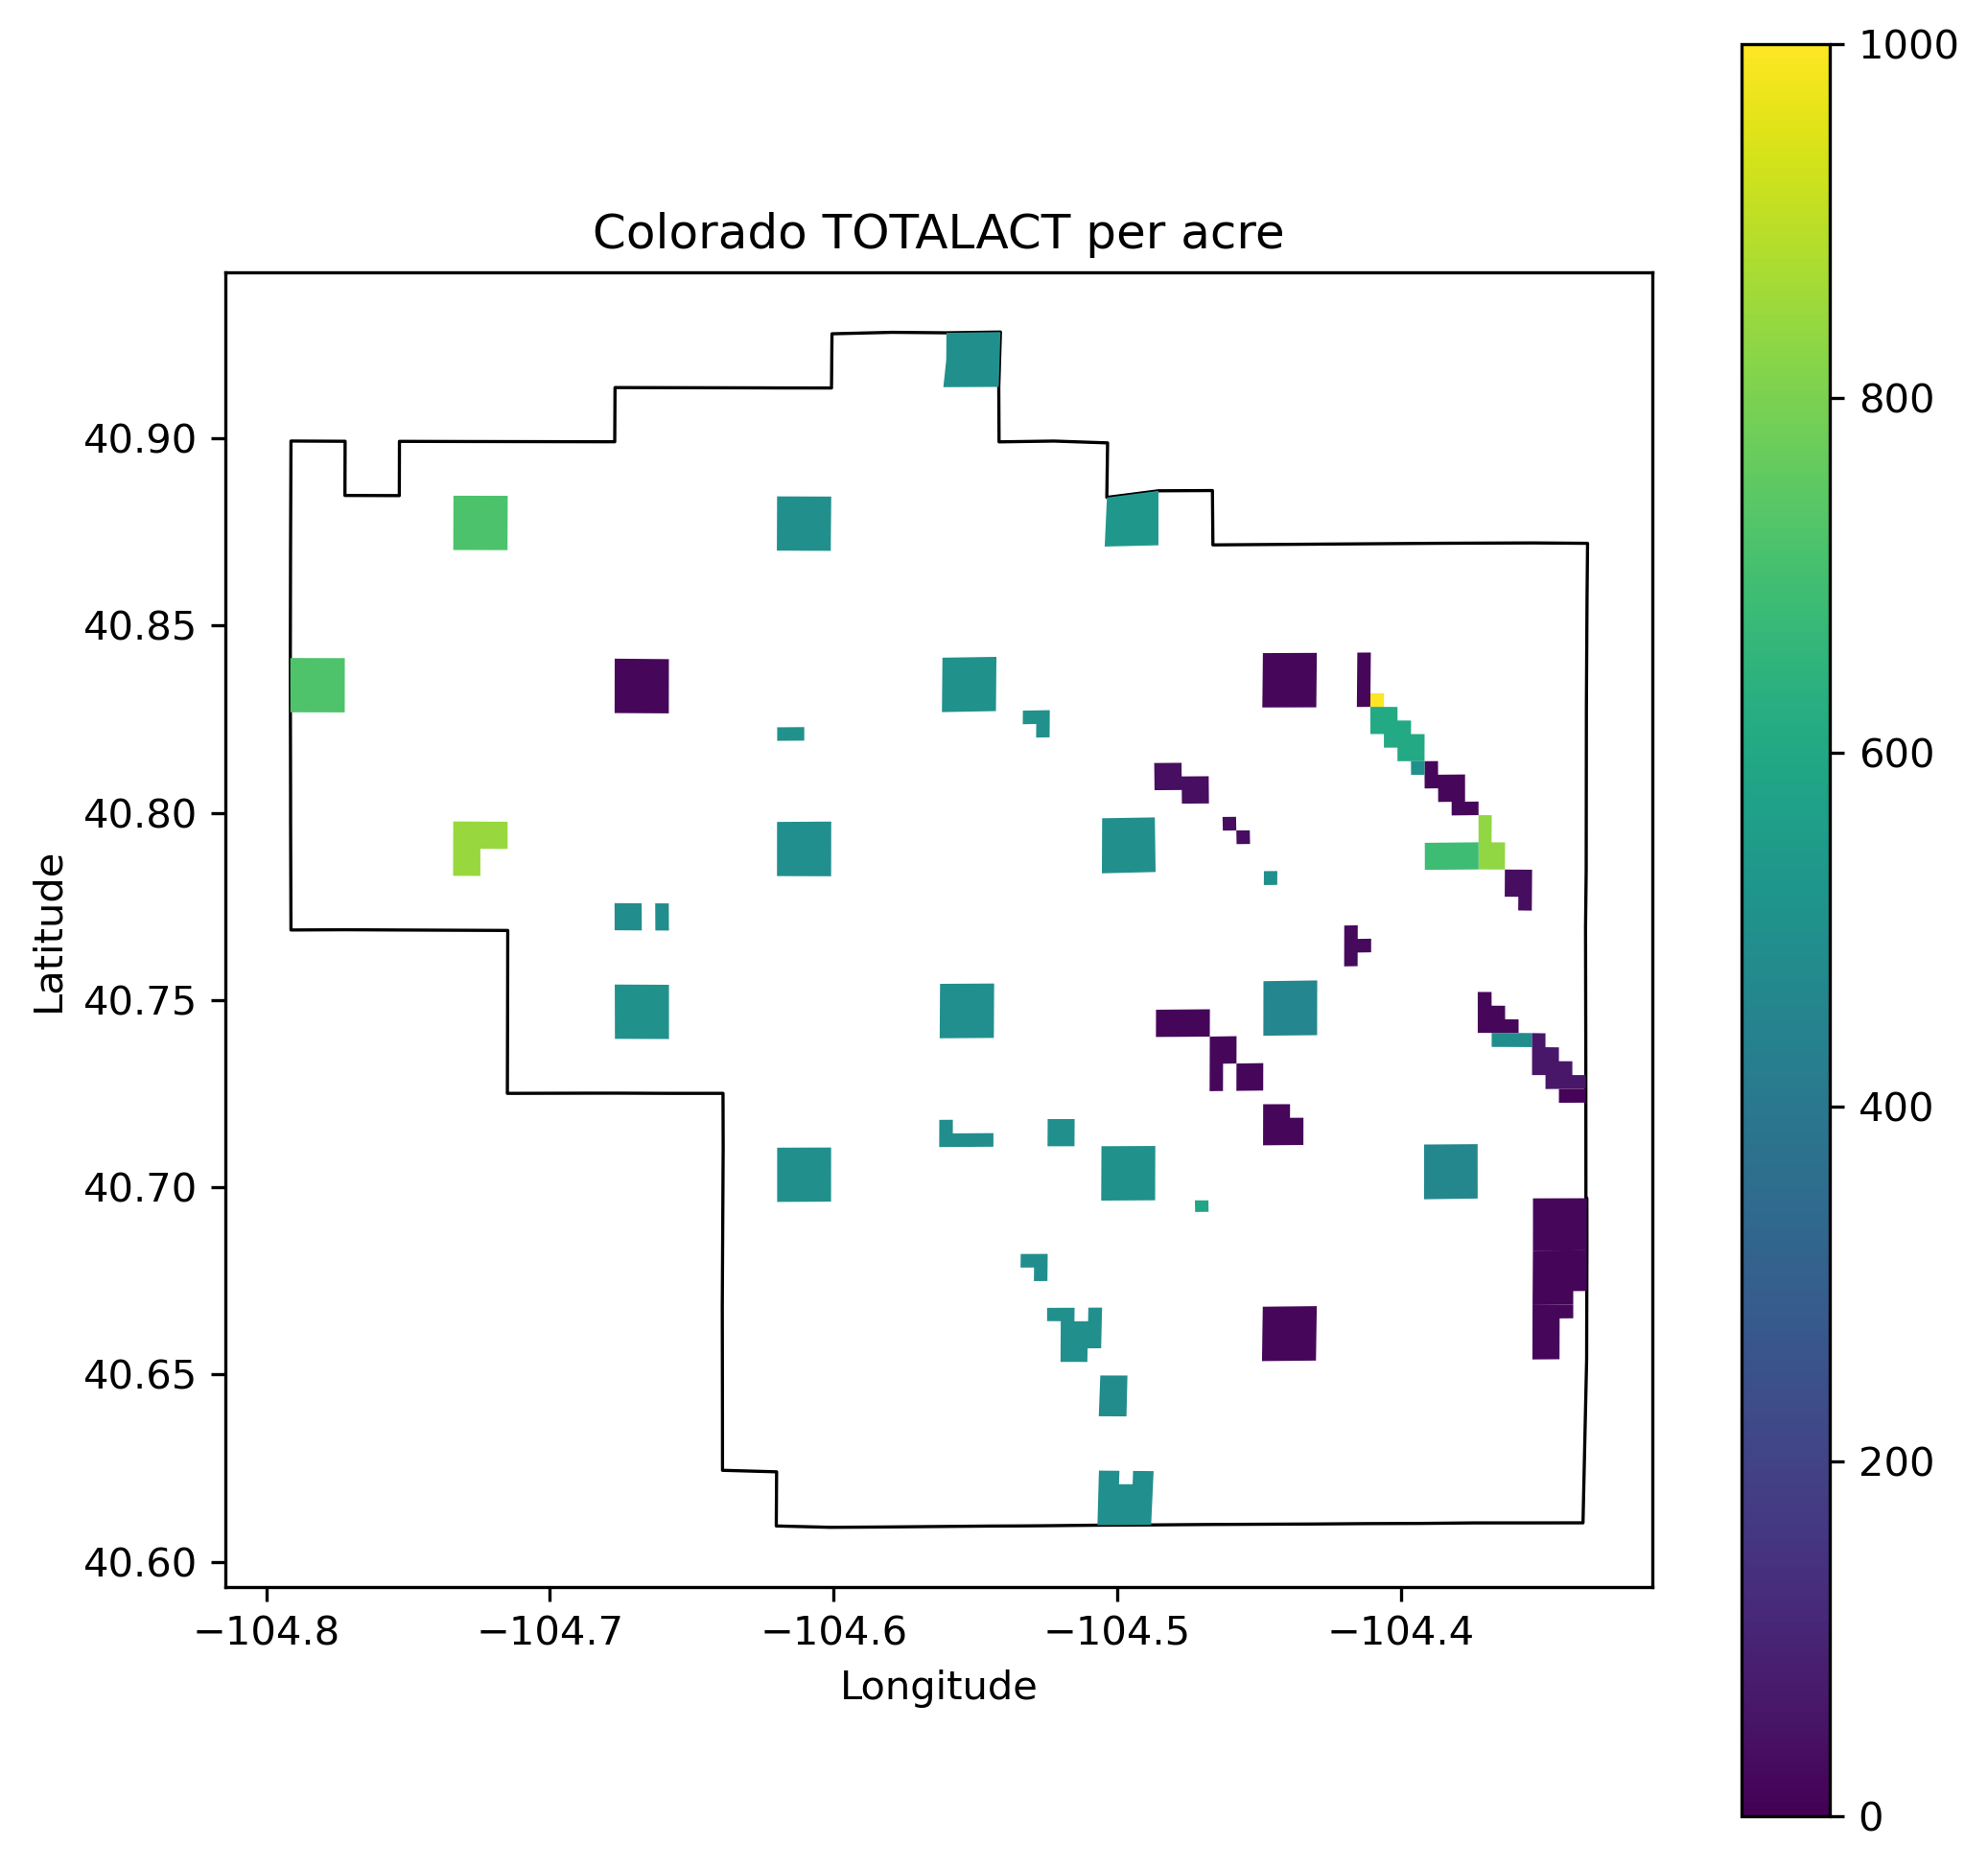
Figure 6: This map shows the total market value per acre for state parcels on Western Pawnee (the legend is in US Dollars). We can see compared to federal lands, that state lands are not worth as much per acre. Also, there are far, far fewer state parcels available in Western Pawnee to swap.
For potential land swaps, this means that we should carefully consider whether or not we are swapping lands of equal or greater value. Similarly, any parcels with oil/gas or other infrastructure is likely a poor candidate for swapping. Once we create the parcel matrix to pick land swap candidates we will need to exclude these kinds of parcels as options.
Contiguous Area Measures
We built two evaluation criteria to measure contiguous area within Pawnee National Grassland. First, we defined contiguous patches for Federal parcels. These were defined as any two parcels that share at least one side. Touching corners did not count as contiguous.
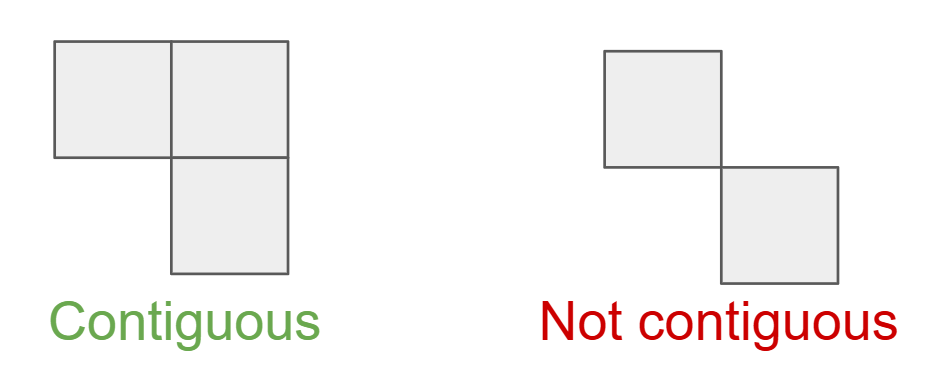
Figure 7: (Left) Contiguous patches share at least one side. (Right) Parcels touching corners were not considered contiguous.
We then evaluated total area of all contiguous patches to determine the largest Federal holdings. Optimizing for total area would allow managers to apply treatment to broader areas of land.
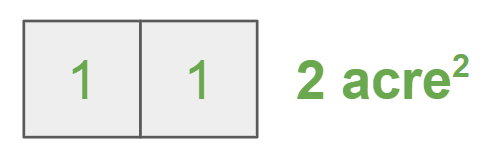
Figure 8: Total area calculation.
Exterior edges of patches represent land that PNG cannot manage. To understand how compact each patch was, we calculated an interior edge ratio. This ratio is the sum of the interior edge lengths / sum of the exterior edge lengths. More compact patches will have a higher interior edge ratio. These compact patches minimize the interface between managed land and unmanaged land.
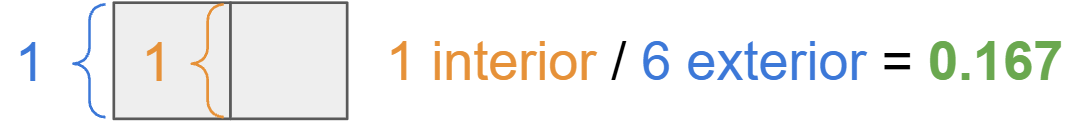
Figure 9: Edge ratio calculation.
We end up with two maps of federal patches colored by total area and internal edge ratio. Patches with high total area and high internal edge ratio would be candidates for receiving land swap. Low scores across these two metrics would be candidates for an outgoing swap.
Figure 10: (Left) Total area patches, colored by area rank. Green patches have a higher total area compared to red patches. (Right) Interior edge patches, colored by score. Green patches have a higher ratio of interior edges.
Conclusion
The Pawnee National Grassland’s fragmented ownership is an ongoing challenge for coordinated land management. This portfolio demonstrates that multiple metrics (e.g. species composition, land value, patch area, and compactness) can be used to identify high-impact land swap candidates. We will further refine the metrics we use to evaluate swap candidates and develop a tool that allows stakeholders to test land swapping.
Works Cited
Baynard, C. W., Mjachina, K., Richardson, R. D., Schupp, R. W., Lambert, J. D., & Chibilyev, A. A. (2017). Energy development in Colorado’s Pawnee National Grasslands: Mapping and measuring the disturbance footprint of renewables and non-renewables. Environmental Management, 59, 995–1016. https://doi.org/10.1007/s00267-017-0846-z
Hazlett, Donald L. 1998. Vascular plant species of the Pawnee National Grassland. General Technical Report RMRS-GTR-17. Fort Collins, CO: U.S. Department of Agriculture, Forest Service, Rocky Mountain Research Station. 26 p. https://research.fs.usda.gov/download/treesearch/25015.pdf
Kotliar, Natasha B., Brian J. Miller, Richard P. Reading, and Timothy W. Clark. “The Prairie Dog as a Keystone Species.” In Conservation of the Black-Tailed Prairie Dog: Saving North America’s Western Grasslands, edited by John Hoogland, pp. 53–64. Washington, DC: Island Press, 2006.
Millspaugh, Joshua, Jesse DeVoe, and Kelly Proffitt. Pronghorn Movement and Population Ecology Project: 2021 Annual Interim Report. Federal Aid in Wildlife Restoration Grant W-176-R. Missoula and Bozeman: Montana Fish, Wildlife & Parks and University of Montana, September 2021. https://fwp.mt.gov/binaries/content/assets/fwp/conservation/pronghorn/p-r-report—montana-pronghorn-project—2021.pdf.
Powers, L. C., Larsen, A. E., Leonard, B., & Plantinga, A. J. (2022). Reconnecting stranded public lands is a win-win for conservation and people. Biological Conservation, 270, 109557. https://doi.org/10.1016/j.biocon.2022.109557
Rhoads, Dorothy, and Lee Rhoads. (n.d.). History of the Pawnee National Grassland. U.S. Forest Service. https://www.fs.usda.gov/media/71487
Riitters, K. H. (2013). Fragmentation of forest, grassland, and shrubland. In K. M. Potter & B. L. Conkling (Eds.), Forest Health Monitoring: National status, trends, and analysis 2010 (Gen. Tech. Rep. SRS-GTR-176, pp. 53–65). U.S. Department of Agriculture, Forest Service, Southern Research Station.
U.S. Forest Service. (n.d.). The national grasslands story. U.S. Department of Agriculture. https://www.fs.usda.gov/managing-land/national-forests-grasslands/national-grasslands/about-us
Weld County GIS. (2026). Weld County real property parcels [Dataset]. Weld County GIS Hub. https://gishub.weldgov.com/datasets/37d03225dab04760b4fd9f5f531d313e_0/explore